Capture data, static or dynamic, then view, analyze, and filter that data. When you're ready, send commands back to the system providing the data. What kind of data? Any data which can be time-tagged as discrete samples; telemetry, simulation output, stocks prices, regional temperatures - you decide. Not only can you capture any of these, you can capture all of them at once and VisualCommander will seamlessly integrate them into a unified data hierarchy.
Click on a link to learn more.
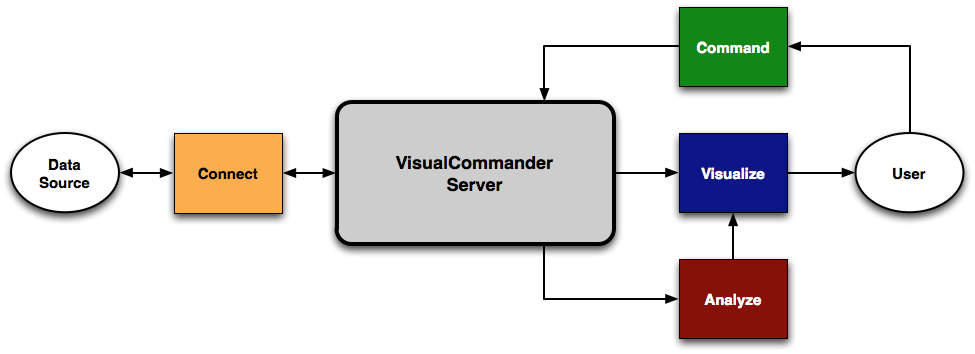
Where does the data come from? VisualCommander doesn't provide the data itself, it captures it via plugin modules designed specifically for the systems to which they connect. These plugins are written in C++ using an included Xcode template and can be added to VisualCommander by any user.
In addition, VisualCommander includes a full-featured simulation engine, DSim, which can be configured to simulate arbitrarily complex physical models. Finally, light-weight data generation can be achieved within VisualCommander using Data Processors.
Click on a link to learn more.
Once you have your data coming into VisualCommander, you want to see it! "Interface" documents provide one or more windows dedicated to data display. Data displays are elements which are drawn in these windows which show data in specific ways. Some displays may provide a basic numeric value, others are 2 and 3 dimensional plots, and still others are full-scale "virtual reality" displays where 3 dimensional objects can be constructed, lit, and rendered based on input data. The purpose of data visualization is to gain a better understanding of the data's significance. With VisualCommander, you aren't limited to the builtin displays - if you have a new idea for a way to effectively display data you can build it yourself and add it to your interface documents.
Click on a link to learn more.